- HODL My Beer
- Posts
- Critical Bitcoin Price Levels and Dates To Watch
Critical Bitcoin Price Levels and Dates To Watch
Gann, Ichimoku, and other tinfoil hat stuff.
HODL My Beer
June 17, 2024

🍻 Here’s what’s on tap 🍺
I’m back! A week off for our yearly trip to Minnesota for some fishing on Leech Lake proved to be an awesome time for my wife, myself, and the kids. But I caught zero fish. Fucking mayflies.
Today’s issue is short and sweet and focuses on Bitcoin’s price action. The rest of the week we’ll be looking at the opportunities for those who like the long and short side of the market. Good to know what each side is looking at.
Beer Goggle Charts 🥸
First things first, let’s look at this analysis for Bitcoin that we looked at in the June 5 HODL My Beer:

June 5 BTCUSD Daily Chart - Click to enlarge.
Let’s do some Gann Analysis for Bitcoin that indicate possible turning points for Bitcoin in June and August.
Key Dates to Watch for Bitcoin
June 12 - 90 days from the March 14, 2024 ATH.
June 15 - 45 days from May 1 swing low. 144 days from January 23 low.
June 17 - 90-degree Gann Square of 9 angle.
June 21: End of Gann period for annual highs and lows.
June 22 - Gann date; Summer begins.
July 21 - 180 days from January 23 low.
Week of July 22 - 45 weekly bars from September 11, 2023 swing low.
August 11 - 180-degree Gann Square of 9 angle.
Week of August 12 - 90 weekly bars from November 21, 2022 swing low.
August 14-22 - Astronomical cluster range.
Key Price Levels
June - $66,564 $57,121 $44,944 $81,225 $93,025 $110,224
August - $64,516 $54,289 $41,616 $84,100 $96,721 $115,600
Watch these dates and levels for rapid Bitcoin market movements. 👀
And here’s what Bitcoin’s chart looks like right now:
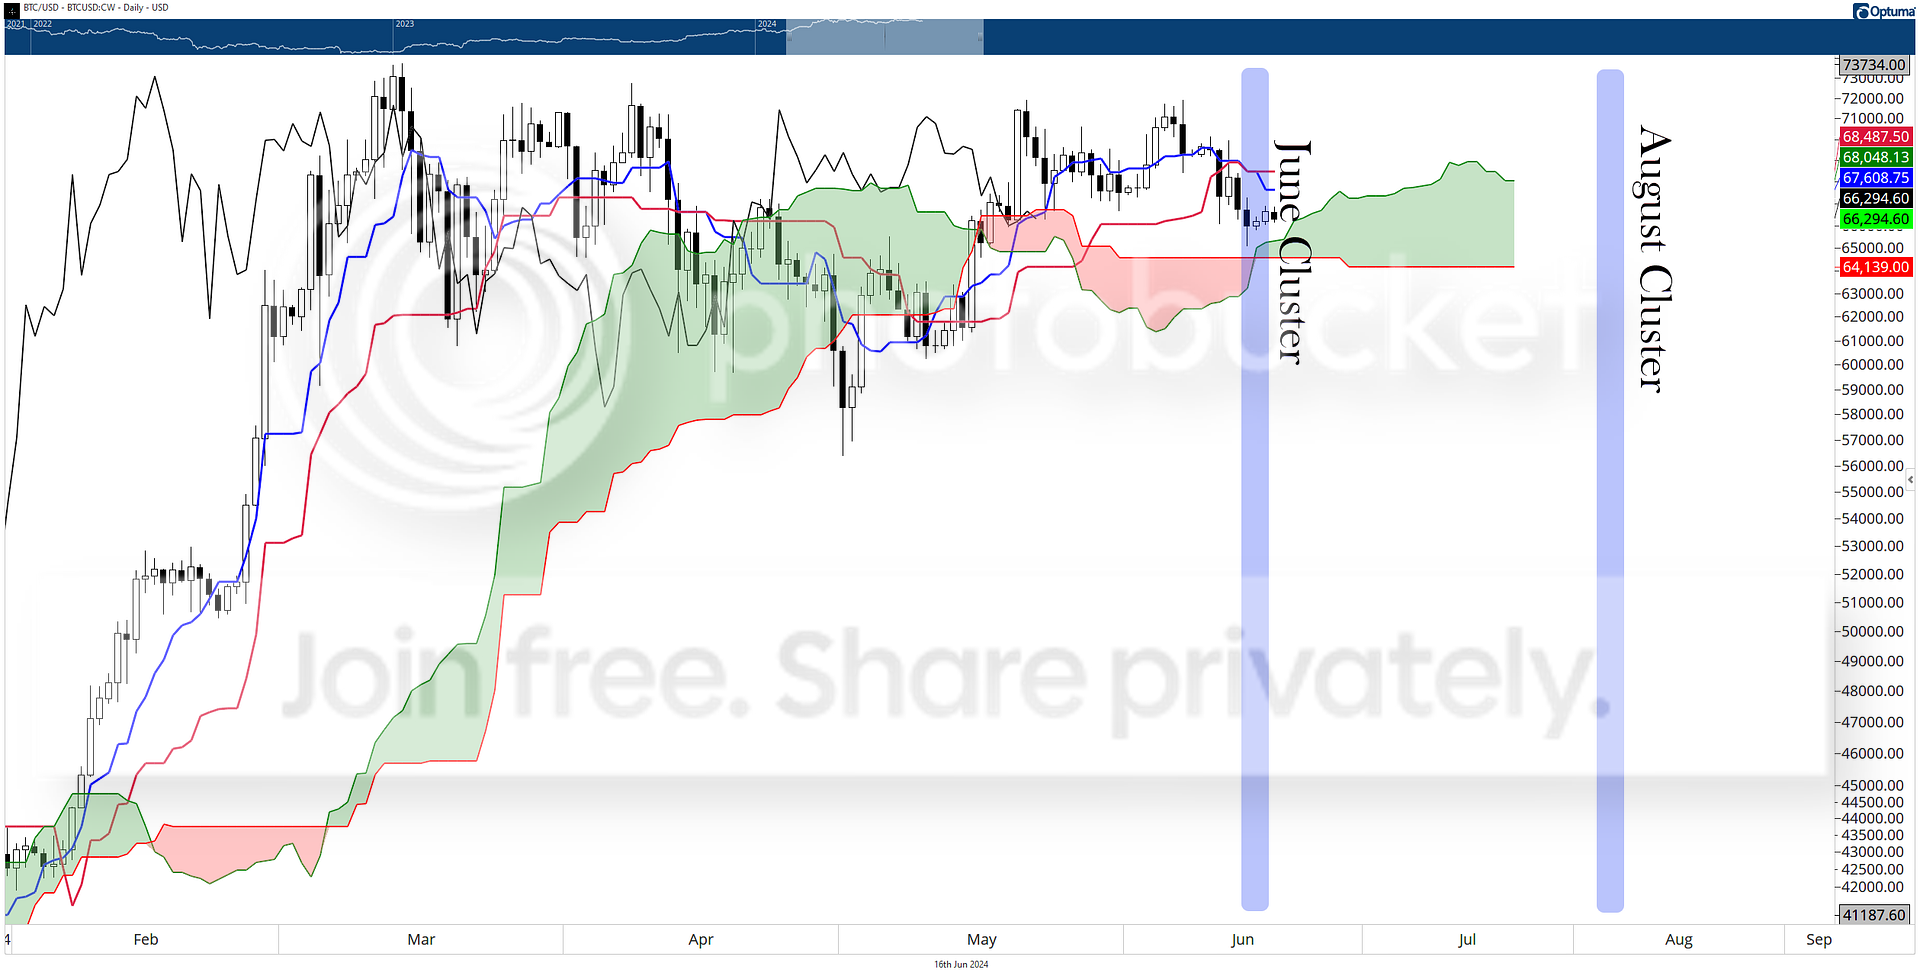
BTCUSD Daily Chart - Click to enlarge.
Key Observations For Bitcoin’s Current Daily Chart
Bitcoin has trended lower ever since June 5, falling as much as -8.4%.
There is a strong probability of the Kumo Twist on June 15 acting letting us know sellers aboot to get fooked.
The $66,564 price level is proving to be a critical zone for bulls and bears to duke it out.
Primary support for Bitcoin is the weekly Tenkan-Sen (not shown) at $64,232 and the daily Senkou Span B at $64,639. A close on any of those time frames below those levels could be ugly for bulls.
There are still five more days in this June cluster. The last two days, June 21 and June 2022, may be fooking crazy. There’s a Full Moon on the 21st, so the warning for the bulls here is: shit could get even uglier.
The next important Gann Square of 9 price level for is $57,121, which is very close to the weekly Kijun-Sen at $56,126.
Oscillator Levels
Bitcoin’s daily oscillators are looking fairly supportive for a bounce.

BTCUSD Daily Chart - Click to enlarge.
The Composite Index continues to respond to a historical support level, most recently bouncing off that level on June 15.
The Optex Bands oscillator is dipping into overbought territory. It’s currently at a 3-month low.
The oscillator I am going to watch very, very carefully, is the 7-period Detrended Price Oscillator. If it crosses and closes above the zero-line, Bitcoin will likely rip higher. If it tests the zero line and continues lower - look out below.
🔼 Want crypto news that’s short, sweet, and to the point? Subscribe to The Pudge Report.
🔼 Want quick and easy updates on GameFi and Play-To-Earn? Subscriber to my Loot Ledger newsletter.
🧠 And don’t forget to read my Stocktwits’ crypto newsletter, The Litepaper.
📈 For you stonk people, here’s The Daily Rip.
Nice Charts Can Be Found Here 📈

Cluster Dates 📅
Derived from NASA's Jet Propulsion Laboratory data and analyzed through the lens of Gann Analysis, the ensuing date intervals warrant close observation, particularly when a market or specific instrument exhibits strong directional momentum. In such instances, there's a substantial likelihood of witnessing a sharp reversal in trend around these pivotal dates.
In other words: put these in your calendar in ALL CAPS and write something like PAY THE F*CK ATTENTION KK THNX.
May 17-28
July 15
August 14 -22
September 7-17
November 17-19
Gann Stuffs - Don Thy Tinfoil Hat 🧙
The following dates and prices come from Gann’s Square of 9. The Square of 9 was one of Gann’s tools that he used to identify when and at what price levels major changes in an instrument could occur.
Pay special attention if Bitcoin trades at any of the price levels on/near any of those dates, especially if they share the same degree.
For example, if Bitcoin is trading near 52,441 on March 30, 2024 (both are 180-degree levels), watch for major moves to occur.
Time2024 0-degrees: 5/5, 6/7, 7/18, 9/5, 11/1 90-degrees: 5/13, 6/17, 7/30, 9/19, 11/17 180-degrees: 5/21, 6/27, 8/11, 10/3, 12/3 270-degrees: 5/29, 7/7, 8/23. 10/17, 12/19 2025 0-degrees: 3/19, 6/8, 9/5, 12/11 90-degrees: 1/23, 4/8, 6/30, 9/29 180-degrees: 2/10, 4/28, 7/22, 10/3 270-degrees: 2/28, 5/18, 8/13, 11/16 | Price (Ascending)0-degrees: 79,524 89,401 104,976 127,449 158,804 199,809 254,016 323,761 412,164 522,729 659,344 90-degrees: 81,225 93,025 110,224 134,689 168,100 212,521 270,400 344,569 438,244 555,025 693,889 180-degrees: 84,100 96,721 115,600 142,129 178,084 225,625 287,296 366,025 465,124 588,289 739,600 270-degrees: 77,841 86,436 100,489 121,104 188,356 239,121 304,704 388,129 492,804 622,521 781,456 Price (Descending)0-degrees: 68,664 60,025 48,400 34,969 21,316 9,409 90-degrees: 66,564 57,121 44,944 31,329 17,956 6,889 180-degrees: 64,516 54,289 41,616 27,889 14,884 4,761 270-degrees: 62,500 51,529 38,416 24,649 12,100 |
Follow Me ✅


See You Next Time 👋
